As we mentioned earlier this month, Jacinda’s right that you’re getting fleeced on petrol.
But it’s not big oil raking it in, it’s the state. They’re charging you nearly a dollar for every litre you pump!
So when Statistics NZ revealed that petrol is up 19% year-on-year…you know exactly why it’s happening.
It’s because the powers that be have decided they deserve a little bit more of your earnings…
…so they can fund Crown limousines for their national roadshows…
…so they can stay at luxury resorts with their families…
…so they can fly first-class around the world…
What do they care if fuel is a bit more expensive? You’re the one paying to fill up their tanks, after all…
And fuel isn’t the only thing that’s gotten more expensive. According to the NZ Herald, Kiwis have felt their cost of living skyrocket in recent months:
- Tobacco is up 11%
- Public transport up 5.6%
- Council rates up 5.1%
- Rent up 2.3%
- Construction up 4.1%
Altogether, it’s resulted in a 0.9% rise in the Consumer Price Index (CPI) for the three months ended September 30th.
For reference, central banks typically aim for inflation to hit 2% across four quarters.
If we keep up the current rate of inflation, it will mean that the increasing price of goods could outstrip increases in wages. According to Stats NZ, wages have grown 3% year-on-year compared to an adjusted increase in inflation of 3.6%.
In other words, your pay cheque might not go as far.
That’s why it’s important to calculate the ‘real’ inflation rate (CPI divided by wage growth) because that’s the number that you feel in your wallet.
But the CPI is fallible…
In New Zealand, it’s calculated based on a basket of 690 goods and services. These products are divided into 11 categories:
- food
- alcoholic beverages and tobacco
- clothing and footwear
- housing and household utilities
- household contents and services
- health
- transport
- communication
- recreation and culture
- education
- miscellaneous goods and services.
It’s like if you went into a department store and bought the same 690 products every month…and compared the receipts. Over time, you’d see it creep up. That’s inflation.
But there’s a lot of other factors not included — how much you make, how many hours you work, your income tax rate, etc.
So CPI alone only gives a limited glimpse into your real cost of living. [openx slug=inpost]
Put it in the context of your working hours and you get a much broader perspective of today’s cost of living.
One of the best ways to value your purchasing power is through housing affordability…or more specifically, the housing-price-to-income multiple.
It’s calculated by taking the average Kiwi’s gross annual income and the average house price…and figuring out how many years it would take to buy that house.
It doesn’t take taxes or interest into consideration — it’s a quick paper-napkin index.
So, let’s say you make $50,000 each year. If the average house costs $200,000, then the multiple would be four (four years x $50,000=$200,000).
Unfortunately, as you well know, New Zealand houses are far more expensive than that.
According to Stats NZ, the average annual gross income is $51,844 . REINZ reports that the average home price is $556,000.
That’s a house-price-to-income multiple of 10.7.
In other words, if the average Kiwi saved every penny of their gross income for a decade, they’d nearly have enough to buy an average house.
According to researcher Shamubeel Eaqub, between the ‘50s and ‘80s, Kiwi houses cost between two and three times annual income.
No wonder millennials like to say how easy it was for Boomers.
Check out this graph by Gareth Vaughan from Interest.co.nz:
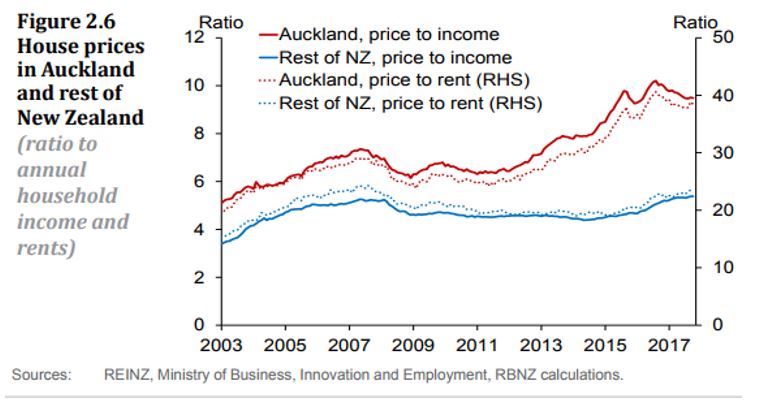 |
Source: Interest.co.nz |
This graph shows how the house-price-to-income multiple skyrocketed between 2003 and 2017…and as we know from out last calculation, it’s jumped even higher since.
In 2003, Auckland alone was at about a multiple of five. That’s already extremely high. Within 14 years, it will scrape the 10-multiple ceiling.
That’s why the OECD and IMF put New Zealand as the WORST country in terms of housing-price-to-income multiple in the world.
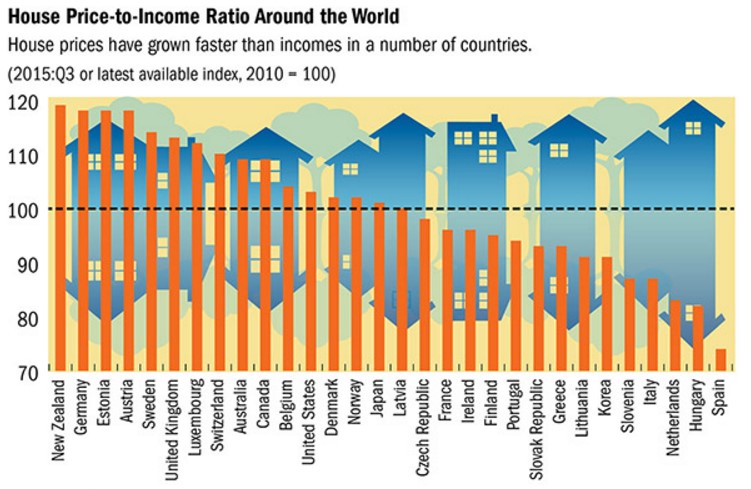 |
Source: OECD |
What it all means…
For Kiwis, this data means that you’re paying a premium to live here in the Land of the Long White Cloud.
You’re having to work longer and harder to get by.
And for retirees, this means that your savings won’t go as far.
If you’re planning to retire soon — or have just retired — it may be a good time to review your portfolio.
Home purchases…travel…medical expenses…
These costs are changing on a daily basis — and generally for the worse. It’s the new reality for older Kiwis.
Fortunately, here at Money Morning New Zealand, we believe that the market holds great opportunities for today’s investors.
We’ve isolated several growing trends that could help give your nest egg the boost you want.
Check out this free report for more information:
Best,
Taylor Kee
Editor, Money Morning New Zealand
Taylor Kee is the lead Editor at Money Morning NZ. With a background in the financial publishing industry, Taylor knows how simple, yet difficult investing can be. He has worked with a range of assets classes, and with some of the world’s most thought-provoking financial writers, including Bill Bonner, Dan Denning, Doug Casey, and more. But he’s found his niche in macroeconomics and the excitement of technology investments. And Taylor is looking forward to the opportunity to share his thoughts on where New Zealand’s economy is going next and the opportunities it presents. Taylor shares these ideas with Money Morning NZ readers each day.