Here in Alaska, oil and gas have dominated the economy for decades. It’s created a sort of ‘banana republic’ — where a single good determines the prosperity of an entire population.
During periods of high oil prices, the local economy flourishes. When it’s down, everyone feels the hit.
In the ‘70s and ‘80s, oil was in high demand…and drillers in Alaska were making the big bucks. The state taxed the oil companies and the revenue flowed in.
It allowed the state to operate without an income tax, property tax or sales tax.
And then the government had a surprisingly good idea — they established a sovereign wealth fund and put it in the hands of private fund managers.
It grew from $734,000 in 1977 to approximately $53.7 billion as of 2015.
And to sweeten the deal, the fund is structured so that it issues a ‘Permanent Fund Dividend’ (PFD) each year to Alaskan residents. A cheque with no strings attached.
The PFD typically runs between $1,000 and $2,000 per resident.
That’s right — no taxes. Instead, everyone gets ‘paid’ to live here.
If you can get past the four hours of daylight in the winter…and the constant threat of predators like bears…then Alaska could be a great place to spend your days.
Tearing down the façade
Let’s turn our attention now to life in New Zealand.
Let’s say you borrow a billion dollars and go buy a couple of yachts, a mansion in Remuera, and a Maserati. At first glance, people might think you’re doing well. But it’s all debt…maybe you could extend your Gatsby lifestyle by borrowing more and more….but eventually, all that debt will come due…and you’ll fall back to reality.
Today, the Kiwi market is full of those mansions and Maseratis. Perma-bulls love to point them out as evidence of a healthy market, but that only works if you ignore the rest of the picture.
Take a look at how debt has driven up GDP:
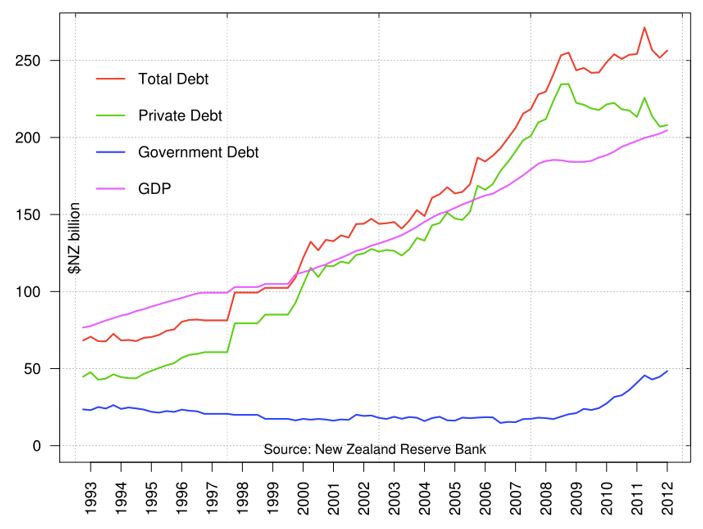 |
Source: New Zealand Reserve Bank |
The pink line is GDP. Everyone loves to see that upward angle. But the red line reveals the dirty little secret — that it’s a façade. And to make it worse, the red line has crossed above the pink line. Debt is growing faster than GDP.
In other words, our economy is getting worse at turning borrowed dollars into product.
And that’s a double-whammy because we’re in a period of ‘easy money’.
If the RBNZ hikes interest rates, New Zealand will have fewer borrowed dollars available. When combined with less efficient GDP-to-debt, this could mean a sharp drop in GDP.
That could trickle down to business profits, wages, stock prices, home prices and beyond.
It’s a real threat and one that deserves consideration…even if it paints a scary picture. [openx slug=inpost]
Nolan’s indicators
Yesterday, we took a look at an article on Interest.co.nz by Matt Nolan. He’s analysing 10 economic indicators in terms of New Zealand’s economy.
Here at Money Morning New Zealand, we always try to take economic analysis with a grain of salt. It’s not a science…it’s a guessing game. Sometimes you’re on the money. Other times you’d be better off flipping a coin.
But with that in mind, economic indicators can be a useful way to turn your guess into an educated guess.
In yesterday’s article, we investigated Nolan’s first five indicators: the consumer price index, the official cash rate, confidence, unemployment and the cost of labour.
We found that some of these readings are deviating off the model…revealing that we’re entering uncharted territory.
The next, and perhaps most telling indicator, is real gross domestic product (GDP).
Over the past decade, Kiwi GDP has been solid. It recovered from a subzero level during the Great Financial Crisis and has bounced back to around 3%. A good sign.
In terms of GDP per capita, the growth rates are a little more subdued…probably because of the influx of migrants.
More recently, GDP growth has plateaued…which has led many in the mainstream to proclaim that this is the end of the bull cycle.
But Nolan suggests that the investment aspect of GDP — like machinery or technological upgrades — have skewed the numbers a bit…and that the adjusted indicator actually looks pretty normal. We have a different idea as to why the numbers are skewed, but more on that later…
Next, he calls on nominal GDP. The difference between nominal and real GDP is that real GDP adjusts for inflation…that makes it more useful to your average consumer.
With such a trade-dependent economy as New Zealand’s, it’s critical to put nominal GDP in the context of import and export prices.
Nolan found that New Zealand has enjoyed strong export prices and lower-than-average import prices. That two-edged sword has helped drive nominal GDP over the 5% threshold. Again, a sign of good health.
Finally, Nolan looks at debt. We think that prolific and cheap borrowing has heavily propped up post-Great Financial Crisis New Zealand.
Nolan found that household debt-to-GDP has ‘stabilised’ around 90% of GDP. He found that result pretty normal.
In fact, Nolan thinks that the numbers look healthy…and that the extraordinarily low RBNZ interest rates are appropriate.
He’s not alone. Heaps of other economists like to call this the ‘new normal’. And he may be right.
But here’s where Nolan loses us. We think that it would be remiss to ignore the connection between debt and GDP…or debt and stock prices…or debt and house prices.
We don’t feel that we can responsibly proclaim today’s market as healthy.
We know too much about the artificial stilts that hold it up — debt, easy money, property bubble, etc. They’re all red flags that make us uneasy.
And if you’re invested in the Kiwi economy…through stocks or property or a KiwiSaver…these red flags could be threats to your wealth.
Tomorrow, we’ll dig a little deeper and try to connect the dots…
Best,
Taylor Kee
Editor, Money Morning New Zealand
Taylor Kee is the lead Editor at Money Morning NZ. With a background in the financial publishing industry, Taylor knows how simple, yet difficult investing can be. He has worked with a range of assets classes, and with some of the world’s most thought-provoking financial writers, including Bill Bonner, Dan Denning, Doug Casey, and more. But he’s found his niche in macroeconomics and the excitement of technology investments. And Taylor is looking forward to the opportunity to share his thoughts on where New Zealand’s economy is going next and the opportunities it presents. Taylor shares these ideas with Money Morning NZ readers each day.