Oil shot up nearly 15% this week. Further hikes were predicted as a result of the drone attacks on Saudi plants. But repairs are being made, and supply is coming back on stream.
Could it be a shock like this that kicks our high market to the floor?
Over the past 50 years, there have been 5 major stock market crashes — where the S&P 500 and other indices have fallen 25% or more.
That equates to a crash every 10 years.
The perfect investor would buy at the bottom…and gain as much as 60% on the way up.
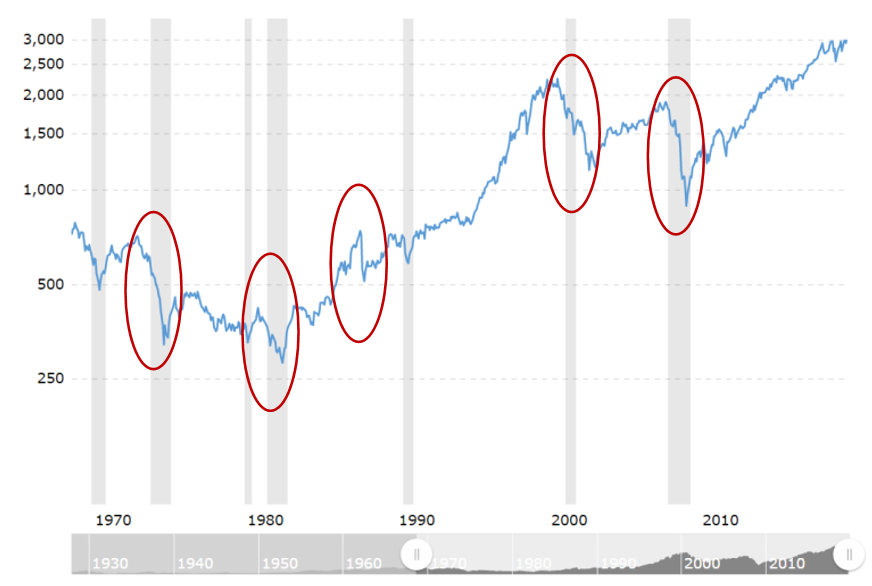
The key crashes you may remember are:
- January 1973 to October 1974
The Arab oil embargo caused the oil shock of the ‘70s and sparked a long recession. Inflation ran at 10%. The total S&P 500 loss from peak to trough was 48%.
- November 1980 to August 1982
Inflation remained a problem. Rising interest rates led to stagflation — high inflation and declining growth. The loss was 27.8%.
- August 1987 to December 1987
Computerised program-trading strategies led to ‘Black Monday’. There were fears of a devalued dollar. The loss was 33.5%. But the recovery was far quicker.
- March 2000 to October 2002
The bursting of the dot-com bubble saw the NASDAQ crash 50%. pulling down other markets. Total loss was 49.1%.
- October 2007 to March 2008
The US housing bubble burst. There was widespread debt defaults, and the collapse of Lehman Brothers. Total loss was 56.4%.
Now, when you look at historical record, there’s no pattern to the frequency of crashes. Only certain telltale signs. An oil shock. Inability to cope with price inflation. And debt default.
There can also be long periods where the market is bullish. For example, from 1987 to 2000. And the period we’re now in.
It’s possible, with little where else for yield, this bullish run could last longer.
Price inflation is a well-known canary in the coal mine. When people fear instability, the price of gold starts rising.
But in the developed world, inflation has thus far been tamed. Interest rates are so low that deflation seems to be the greater fear.
There ain’t much room to expand monetary policy (decrease rates further) to try and offset a sudden oil price shock.
And if central banks tighten monetary policy (increase rates) to rein in the inflation, you have the very real risk of popping asset price bubbles that have built up over the past 10 years. This may lead to property and stock market crashes.
In my book, property is the most vulnerable. Especially in cities like Auckland and Sydney, where prices have been fuelled by high rates of mortgage debt and offshore buyers that are now drying up.
It’s doubtful whether interest rates could increase enough to cause any major sell-off of risk assets like stocks. Since they’re starting from such a low base. But it depends on how deep this oil shock runs. Will there be more attacks? Maybe the risk of a major Middle East conflict?
Right now, I’m focusing on defensive, dividend-paying stocks. And a small allocation in gold or gold-focused companies. Providing you buy at value, you may be able to ride out the next crash.
Of course, nobody knows whether we’re on the cusp of it, or still years away. Past performance is no predictor. The world is different.
But history also repeats. When prices get away, conflicts escalate and oil becomes scarce, there are telltale warning signs. Volatility increases…
Amidst this volatility, there’s opportunity. And hidden opportunities in the global markets.
In our premium research service, we run a model portfolio aiming to take advantage of macro events. It seeks to be defensive in this environment. Most of the picks currently pay dividends from around 4%, to over 10%. Moreover, since we started the analysis in July, capital values are up on average nearly 8%.
Well, of course, past performance is no predictor of future. But this research could certainly transform your portfolio.
Take a look at what we have in store for you today.
Regards,
Simon Angelo
Editor, WealthMorning.com
Simon is the Chief Executive Officer and Publisher at Wealth Morning. He has been investing in the markets since he was 17. He recently spent a couple of years working in the hedge-fund industry in Europe. Before this, he owned an award-winning professional-services business and online-learning company in Auckland for 20 years. He has completed the Certificate in Discretionary Investment Management from the Personal Finance Society (UK), has written a bestselling book, and manages global share portfolios.